
I opened a news site on my phone last week, watched a white screen for what felt like far too long, and did what everyone does: checked the signal bars. The page then arrived and immediately jumped, because something loaded late and pushed the rest down, so the link I was reaching for moved out from under my thumb.
The signal was fine. It usually is. So I spent a morning timing four sites from my own laptop and counting what their pages ask a browser to do, and the answer was not the one the standard advice predicts. The single failure that every performance guide leads with had already been fixed on all four sites. They are still slow.
The short version:
- Most of the wait before anything appears on screen is not downloading. It is a sequence of introductions between your device and the server, and each introduction costs a round trip to wherever that server physically is.
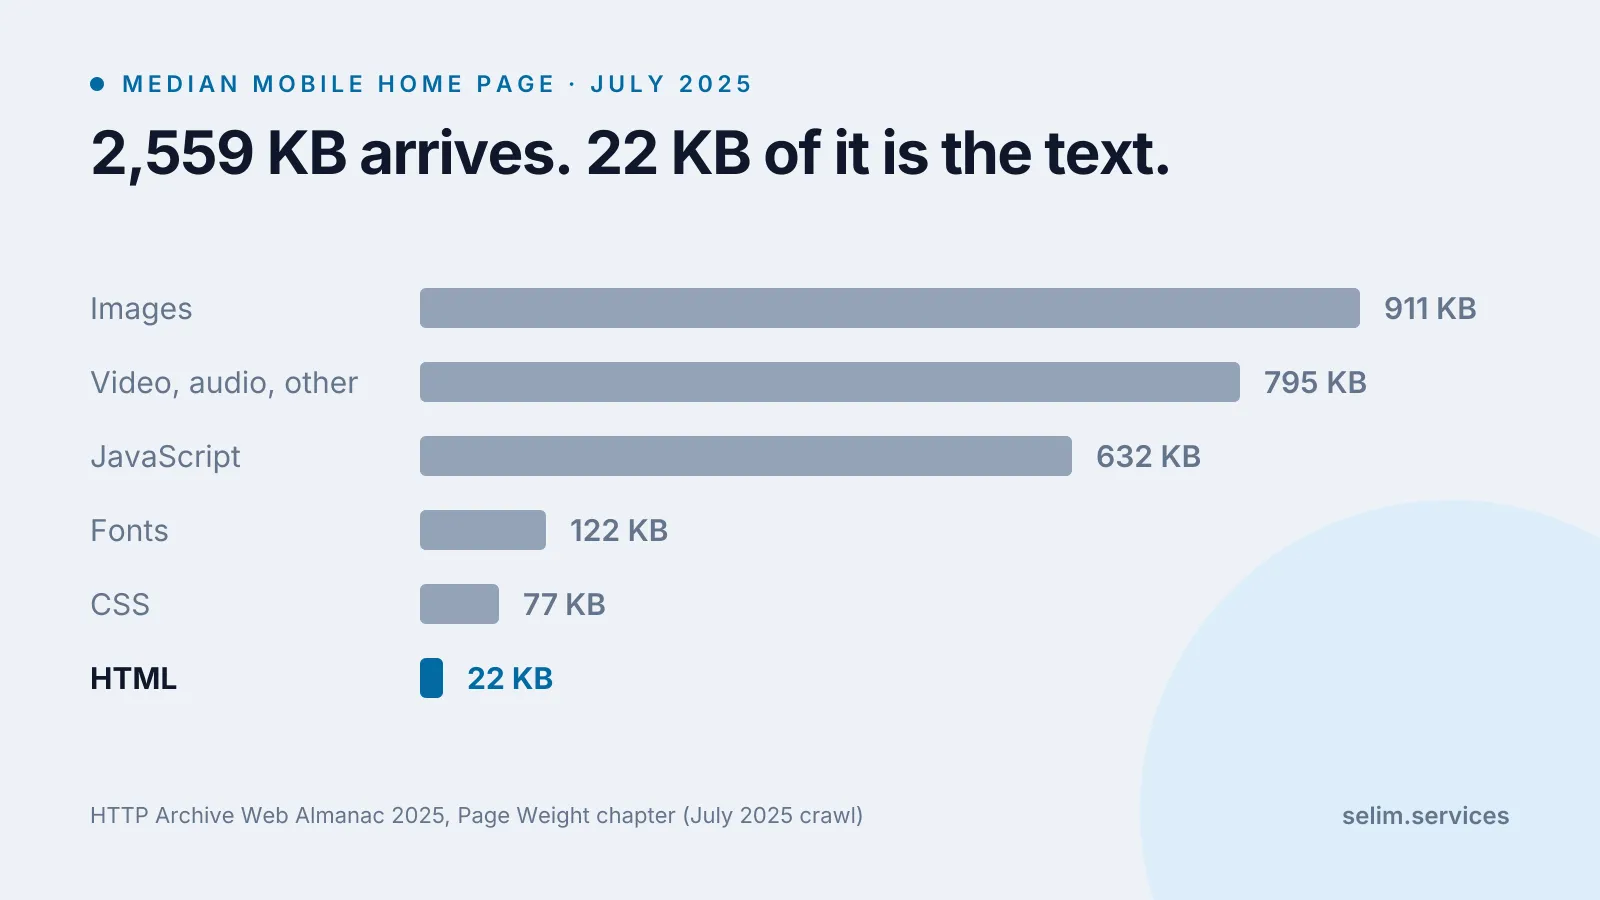
- Most of what does get downloaded is not the thing you came to read. On the median mobile home page, 22 KB out of 2,559 KB is the text.
- The rest of the slowness happens after the download, while your phone works through everything the page asked it to run. That is the part you feel as a tap that does nothing.
What the browser is doing while the screen is white
Before a browser can show you a single word, it has four separate conversations. It has to look up which machine bbc.com refers to. It has to open a connection to that machine. It has to agree on encryption with it. Only then can it ask for the page, and wait for the server to start answering.
Each of those is a round trip, and a round trip costs whatever the distance costs. You can watch it happen with one command. curl will report the moment each phase finished, and -o /dev/null throws the page away so that nothing but the waiting is being measured.[7]
curl -o /dev/null -w 'dns %{time_namelookup} tcp %{time_connect} tls %{time_appconnect} first byte %{time_starttransfer}\n' https://www.bbc.com/dns 0.248912 tcp 0.310931 tls 0.506113 first byte 0.937634Those are running totals rather than four separate costs. The lookup finished at 0.249 seconds; the connection was open at 0.311, so opening it took the 0.062 in between. Not one byte of the page has arrived at any point on that line. The page only starts turning up at the last number.
Here is the same command against four sites. I measured these on 22 August 2026.
| site | dns | tcp | tls | first byte |
|---|---|---|---|---|
www.bbc.com |
0.249 | 0.311 | 0.506 | 0.938 |
en.wikipedia.org |
0.086 | 0.170 | 0.270 | 0.361 |
www.nytimes.com |
0.155 | 0.215 | 0.305 | 0.624 |
selim.services |
0.106 | 0.228 | 0.439 | 0.572 |
The only column where a server is doing any work of its own is the gap between tls and first byte. Everything to the left of that is introductions, and across these four runs the introductions took between half and three quarters of the whole wait.
Now run it a second time, straight away.
| site | dns | tcp | tls | first byte |
|---|---|---|---|---|
www.bbc.com |
0.003 | 0.123 | 0.214 | 0.291 |
en.wikipedia.org |
0.005 | 0.113 | 0.286 | 0.430 |
www.nytimes.com |
0.006 | 0.069 | 0.179 | 0.460 |
selim.services |
0.004 | 0.106 | 0.305 | 0.417 |
The BBC’s lookup went from 0.249 seconds to 0.003, because the answer was cached locally the second time, and its whole time to first byte fell from 0.938 to 0.291. This is the mechanism behind something you have felt without naming: the first page of a site is slow and the next one is fine. You are not imagining it, and the site did not warm up. Your machine stopped asking questions it already knew the answers to.
The encryption step is the one that has quietly improved. TLS 1.3 completes its handshake in a single round trip, and it added a mode that lets a client resume a previous connection with no round trip at all before sending data.[6] It cost between 0.089 and 0.211 seconds in the runs above, rather than the multiples of that older connections paid. Encryption is not what you are waiting for.
Then 2.5 MB arrives, and 22 KB of it is what you came for
Once the first byte lands, the download begins, and the volume is the part that has genuinely got worse. HTTP Archive crawls millions of real pages and publishes the distribution. In its July 2025 crawl the median mobile home page was 2,559 KB and made 72 requests; on desktop, 2,862 KB and 77 requests.[1]
The split is the interesting half. On that median mobile home page: 911 KB of images, 632 KB of JavaScript, 122 KB of fonts, 77 KB of CSS, and 22 KB of HTML.[1] The HTML is the text. It is the article, the product description, the opening hours, the thing you opened the page for. It is under one percent of what your phone downloads.
For scale, the same crawl in July 2015 put the median mobile home page at 845 KB. Phones and networks did get faster over that decade. Pages ate the difference.
The thing every guide tells you to fix is already fixed
This is where I expected to find the villain, and did not.
The classic advice is about parser-blocking scripts. A plain <script src="..."> with no async or defer on it stops the browser mid-parse: the script is “fetched and executed immediately before the browser continues to parse the page”.[4] One slow third-party file in the head, and nothing renders until it arrives. Every performance guide I have ever read opens here.
So I counted, straight from the HTML the server sends, with two commands.
curl -sL https://www.bbc.com/ | grep -o '<script[^>]*src=' | wc -l
curl -sL https://www.bbc.com/ | grep -o '<script[^>]*src=[^>]*>' | grep -vc 'async\|defer\|type="module"'The first counts every script the page pulls in from a file. The second counts only the ones carrying none of the three markers that let the parser keep going, which is to say the ones that block it. For the BBC front page the answers are 58 and 0.
| site | html | scripts | parser-blocking | stylesheet links |
|---|---|---|---|---|
www.bbc.com |
622 KB | 58 | 0 | 0 |
en.wikipedia.org |
254 KB | 1 | 0 | 2 |
www.nytimes.com |
1,297 KB | 9 | 0 | 59 |
selim.services |
77 KB | 3 | 0 | 0 |
Zero, four times out of four. The BBC ships 58 external scripts on its front page and every one of them is marked so the parser does not have to wait. That advice won. It is baked into the framework defaults now, and the sites that were going to absorb it have absorbed it.
What has not gone away is CSS. Stylesheets are still render blocking by design: the browser “can paint the page after it has downloaded the CSS and built the CSS object model”,[5] and it blocks on purpose rather than show you an unstyled page and repaint. The NYT front page links 59 stylesheets. Narrowing the same count to the ones that appear before the closing </head> tag still leaves 26 files, each with its own request, standing between the HTML arriving and the first pixel being drawn.
Note also the raw HTML column. The NYT sends a 1.3 MB HTML document. That is before a single image, script, font or stylesheet is fetched.
The part that happens after the page is “loaded”
Downloading is only the first half. Everything that arrived then has to be parsed, executed and laid out, on your device, using your processor. Google measures the user-visible result of that work with three numbers, and publishes the thresholds a page has to hit at the 75th percentile of real visits: the largest thing on screen should appear within 2.5 seconds, a tap should produce a visible response within 200 milliseconds, and the page should not shift under you by more than a CLS score of 0.1.[3]
Those three map onto the three complaints people actually voice. The screen was blank for ages. I tapped and nothing happened. It moved just as I pressed it.
The middle one is the one people misread as a broken button. Your tap did register. The browser could not draw the response, because it was busy running something else and there is only one queue for that work. Nothing is wrong with the button. Something else was in front of it.
These are also the numbers a stranger is judging you on without knowing their names. If your site exists to convince somebody to hire you or buy from you, the blank second at the start is part of the pitch, which is the reason I ended up writing separately about what a client actually checks in the first thirty seconds.
Nobody chose the third one
More than nine in ten pages load at least one third party, and the median inclusion chain is three deep, meaning most third parties bring another third party with them. The deepest chain HTTP Archive observed was 2,285.[2]
In practice that means somebody in marketing added a tag manager. The tag manager loaded an analytics vendor. The analytics vendor loaded a data partner. Nobody at the company chose the third one, nobody can name it, and it is running on your phone with the same access to the page as everything else. When a site owner tells me they have no idea why their site is slow, this is usually the honest answer, and it is not incompetence. It is a chain that nobody has a complete list of.
Where my own numbers are flattering
My own site is the fastest row in that table and it deserves the least credit for it. It is a static site. Nothing is personalised, nothing is logged in, there is no cart and no live inventory, and I moved it off a server-rendered framework years ago specifically so that every page would be a file on disk rather than something assembled per request. A shop cannot make that trade. Comparing a portfolio to nytimes.com is not a fair fight and I do not want to pretend it is one.
That row also moved under me. When I first ran this in August my home page was a single inlined document of 290 KB, heavier than Wikipedia’s front page, and running the measurement on myself is what pushed me to split it into one screen with each section on its own route. That is how the row above reads 77 KB now, with the stylesheet inlined rather than fetched. Four days after this article went up, the site it measures had changed.
And the heavy sites are not heavy by accident. Those ad and analytics scripts on a news site are the revenue. Removing them is a conversation with a finance team, not a code change. What is fair to say is that most sites carry more of them than anyone chose, because nothing ever removes one.
Two more caveats on my own numbers, since I am asking you to trust them. Every timing above is one machine, one connection, one moment, and the physical distance between it and each of those servers is baked into every figure. Run the command yourself and you will get different numbers, which is rather the point of running it. And the script counts are counts of tags in the HTML, not of requests the browser ends up making: a page can add far more with JavaScript afterwards, and can skip some images entirely if you never scroll to them.
How to check your own site in ten minutes
Nothing here requires you to be a developer.
- Run the first command above against your own domain. If the
tlsnumber is more than about half of thefirst bytenumber, the problem is where your server sits and how it is reached, not the code running on it. - Open your site on a phone, on mobile data, away from the office. Not on the office wifi, three metres from the router, on the laptop that has every file cached already. This costs nothing and catches more than the rest combined.
- Run PageSpeed Insights on your busiest page and ignore the score. Read the three Core Web Vitals numbers and the list of what is blocking rendering instead. The score is a weighted average, and averaging three different problems into one number tells you nothing about which one you have.
- Ask who owns each third-party script on the page. Open your browser’s developer tools, go to the Network tab, sort by domain. Any domain nobody in the company can account for is the first thing to remove, and removing it is free.
If you want the developer-facing version, with the specific fixes rather than the diagnosis, I wrote a Lighthouse checklist from thirty-odd site builds that goes through them one at a time.
I would push you towards the mechanism over the checklist, though, because checklists go stale. Parser-blocking scripts were the whole game, and they are now absent from four front pages out of four, while page weight tripled underneath the advice that was still telling people to look at scripts.